
The quick answer
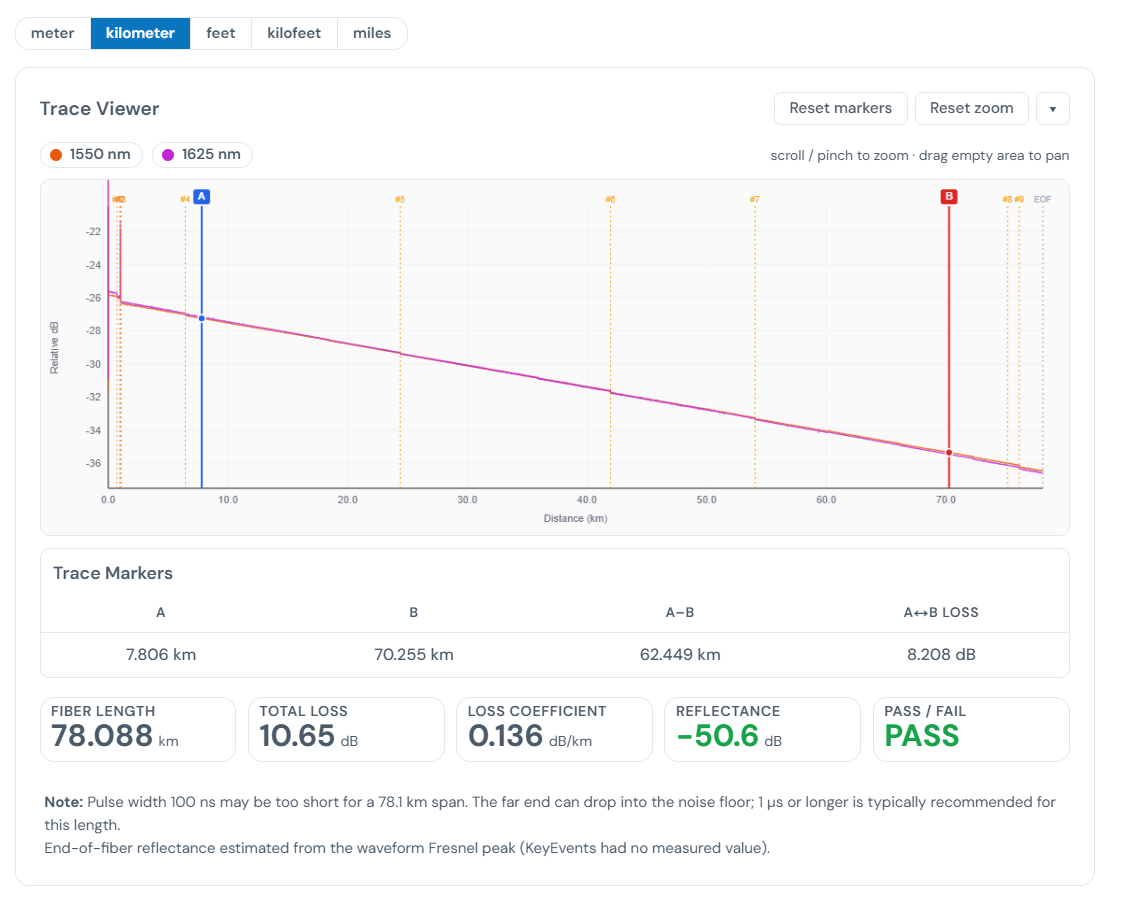
A .trc file from a fiber tester is an OTDR trace saved in EXFO's format. It's the same kind of measurement a .sor file holds: the waveform, the events along the fiber, and the loss and reflectance numbers. To view one, open the free OTDR Trace Viewer and drag the file onto the page. It reads .trc, .trcx, .sor, and .msor, with no EXFO software to install and nothing uploaded.
Open your .trc file now. Drag it onto the viewer and see the trace, span length, loss, and event table, free and in your browser.
Open the OTDR Trace Viewer →What's inside a .trc file
When an EXFO OTDR (an MaxTester, FTB module, or similar) shoots a span, it records the result as a .trc. Inside is everything the instrument measured:
- The trace waveform: backscatter level versus distance down the fiber.
- The event table: each connector, splice, and the fiber end, with its distance, loss, and reflectance.
- Span results: total length, total loss, and the loss coefficient in dB/km.
- Test settings: wavelength, pulse width, range, and averaging time, plus the make and model that recorded it.
It's a binary instrument format, not a document, so double-clicking it does nothing on a normal computer. That's why a .trc looks like a dead file until you load it into something that understands the format.
.trc vs .sor: what's the difference?
Not much, from a field tech's point of view. Both are single-wavelength OTDR traces holding the same kind of data.
.soris the Bellcore / Telcordia SR-4731 standard record, the format most makers can read and write..trc(and.trcx) is EXFO's trace format, written by EXFO instruments and their FastReporter software.
The measurement is the same: distance, loss, reflectance, events. The difference is the container. A good browser viewer reads both, so you don't have to care which one you're holding. If you want the fuller background on the standard format, see how to open a .sor file.
How to open a .trc file (step by step)
- Go to the OTDR Trace Viewer.
- Drag your
.trcfile onto the page, or click the drop area to browse and pick it. - The trace draws immediately. You'll see the waveform, span length, total loss, worst reflectance, and a full event table.
- Drag the A and B markers to measure loss across any section, use the wheel to zoom, and switch wavelengths if the file has more than one.
Nothing uploads. The file is read locally in your browser, so a customer's trace never leaves your device.
My .trc file isn't fiber. What is it?
The .trc extension isn't reserved for OTDRs. If your file didn't come off a fiber tester, it's probably one of these, and the OTDR viewer won't read it (nor should it):
- An IBM Java / WebSphere trace log. These are diagnostic dumps from a Java runtime (often named like
Snap.trcorjavacore-adjacent files). They're application logs, not fiber measurements. - Oscilloscope or instrument captures. Some lab instruments and simulation tools write
.trcwaveform files in their own formats. - Game or application trace/replay files. A handful of programs use
.trcfor unrelated recorded data.
Quick tell: if the file came from an EXFO tester or a fiber contractor, it's an OTDR trace and the viewer will open it. If it came from a server, an IDE, or a piece of software, it isn't fiber and this tool isn't the right one.
Analyzing a whole job, not just one trace
If you've got a folder full of traces from a whole build (both directions, multiple wavelengths, dozens of spans) and want one pass/fail verdict per fiber instead of opening them one at a time, drop the entire job into Fiber Analysis. It groups the files by fiber, reads OTDR, OLTS, and OPM results together, and gives you a per-fiber acceptance table.
Ready to look at your trace? The viewer is free, installs nothing, and keeps your files on your device.
Open the OTDR Trace Viewer →Related
- OTDR Trace Viewer & Analyzer, the free tool that opens .trc / .trcx / .sor / .msor files
- How to open a .sor file
- How to read an OTDR trace
- Fiber Analysis, for a whole job of traces at once
- All field guides