
If you’re moving into high-speed fiber work, you’ll start hearing two acronyms show up in acceptance specs and test plans: CD and PMD. Chromatic Dispersion and Polarization Mode Dispersion. These aren’t loss numbers. They’re signal-distortion numbers. And on 10G, 40G, 100G, and above, they can shut a circuit down even when your loss budget looks clean.
This is the overview. Two deep dives follow: one on PMD, one on CD.
What’s actually happening in the glass
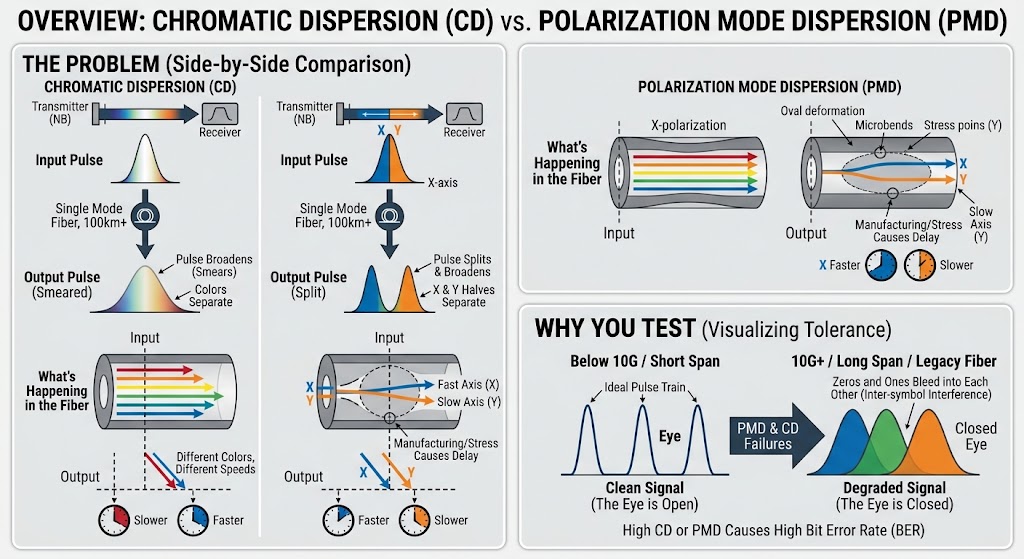
A fiber isn’t a perfect pipe. Light going in isn’t quite the same shape when it comes out. On short spans at low bit rates, this doesn’t matter. On long spans at high bit rates, it matters a lot.
Two things spread the pulse:
Chromatic Dispersion. Different colors of light travel at slightly different speeds through the fiber. Your transmitter isn’t a perfect single-color laser. It puts out a narrow band. The red end of that band arrives a hair later than the blue end. Multiply that by hundreds of kilometers and the pulse smears.
Polarization Mode Dispersion. A single-mode fiber technically carries two versions of your signal at right angles to each other. Call them the X and Y halves. In a perfect fiber they’d travel at the same speed and recombine cleanly. In a real fiber they don’t. Manufacturing variation, mechanical stress, temperature, and cable movement all cause one half to arrive slightly before the other.
Both problems look the same from the receiver’s perspective. The pulse got fatter. The zeros and ones start bleeding into each other. The eye closes.
Why either of them lands on your work order
You test for CD and PMD when the network engineer, the OEM, or the customer tells you the circuit needs to run at 10G or faster, on a span longer than about 40 km, on legacy fiber, or on any route where DWDM is planned.
Below 10G on modern fiber, both are usually a non-issue. That’s why you may have never touched either test.
Above 10G, both become real. On legacy fiber (drawn before the late 1990s), PMD can kill a link even at 10G. On 100G and 400G coherent systems, CD is largely handled by the receiver DSP, but PMD still bites when it exceeds the transceiver’s tolerance window.
The specs you’ll be asked to hit:
| Bit rate | Typical CD tolerance | Typical PMD tolerance |
|---|---|---|
| 10G (direct detect) | 1,000 to 1,500 ps/nm | ~10 ps |
| 40G | 300 to 500 ps/nm | ~5 ps |
| 100G coherent | Very high (DSP handles it) | 25 to 30 ps |
| 400G coherent | Very high | 10 to 15 ps |
Typical values for orientation — always confirm against the exact optic’s spec sheet on the job.
How the tests work at a glance
CD and PMD are both dual-ended tests in most cases. You need a source at one end and an analyzer at the other, coordinated over a radio or phone. Single-ended options exist for PMD (polarization OTDR) but are less common in day-to-day field work.
CD testing launches multiple wavelengths across the operating band, measures the group delay at each, and calculates the dispersion coefficient in ps/(nm·km). One measurement per span, per direction.
PMD testing launches polarized light and measures the differential group delay (DGD) between the two polarization states across the band. Because PMD is statistical (it moves around with temperature and vibration), the analyzer averages many samples and reports back an average DGD in picoseconds, plus a PMD coefficient in ps/√km.
Both tests take between 30 seconds and a few minutes per span, once you’re set up. Setup is the slow part. Splitters, launch cables, and confirming both ends are on the same wavelength plan takes longer than the measurement itself.
What can be done when a link fails
PMD failures on the outside plant are often fixable on the ground. If a section of the run reads high, walk the route. Look for tight cable ties, crushed buffer tubes, over-tight slack loops in a splice enclosure, or unrelieved stress at a hardware entry. Re-dressing a splice tray or loosening a pinch point can drop aggregate DGD dramatically. If the fiber itself is legacy glass with high intrinsic PMD, no amount of re-dressing will fix it. That circuit needs to move to a different pair.
CD failures aren’t fixable at the plant. The dispersion is a property of the fiber and it’s fixed at manufacture. You either compensate for it optically (dispersion compensating fiber or fiber Bragg gratings inserted into the amplifier stages) or you let the receiver’s DSP handle it. On modern coherent systems, DSP compensation is the norm. On older direct-detect systems, you may see DCF modules already installed inline. If the link still fails with those in place, the compensation needs to be retuned by the transport team, not the OSP crew.
Everything gets more detail in the standalone articles.
Test equipment you’ll see in the field
| Manufacturer | Model | CD | PMD | Notes |
|---|---|---|---|---|
| EXFO | FTB-5700 (module in FTB-2 Pro / FTB-4 Pro platform) | Yes | No | Single-ended CD, common on newer builds |
| EXFO | FTB-5500B (module) | No | Yes | Interferometric PMD, dual-ended |
| EXFO | FTB-5800 CD/PMD Analyzer | Yes | Yes | Combined unit |
| Viavi (JDSU) | ODM (Optical Dispersion Module) | Yes | Yes | Runs in the T-BERD/MTS-8000 platform |
| Viavi | MTS-6000A with CD/PMD option | Yes | Yes | Common on service provider trucks |
| Anritsu | Network Master Pro MT1000A + CD/PMD module | Yes | Yes | Full-band scanning, one of the faster units |
| Anritsu | MW90010A / MW90A10A | Yes | Yes | Lab-grade, sometimes on high-value spans |
| VeEX | FX150 series | Yes | Yes | Value-tier option, gaining share |
Vendors refresh their lineups — treat models and CD/PMD support as a starting point and confirm against the current catalog and the unit in your hand.
Newer coherent transport systems can also report CD and PMD directly from the transceiver DSP once a circuit is turned up. That data is useful for baselining a live link, but it doesn’t replace pre-turnup testing. If the circuit won’t come up, you can’t read DSP telemetry off a dark link.
Where to go next
- Read the PMD deep dive for what causes PMD, how the different test methods actually work, and how to troubleshoot a high reading in the field.
- Read the CD deep dive for the fiber types, the compensation options, and why modern coherent networks handle CD differently than the older gear you may have started on.
- If you’re comparing measured loss to design loss on a span, use the Fiber Loss Calculator alongside your OTDR results. CD and PMD are separate from loss, but they show up on the same acceptance report.