
Polarization Mode Dispersion is one of those specs that gets ignored on every job until it kills a circuit. Then you’re the tech standing at the fault, holding a PMD analyzer for the first time, trying to figure out what the numbers mean and what you can actually do about it.
This is the deep dive. If you haven’t read the CD and PMD overview, start there for the big picture. This article covers what PMD actually is, why fiber gets it in the first place, how the four common test methods work, and what you can fix on the ground versus what has to be handed off.
What PMD actually is
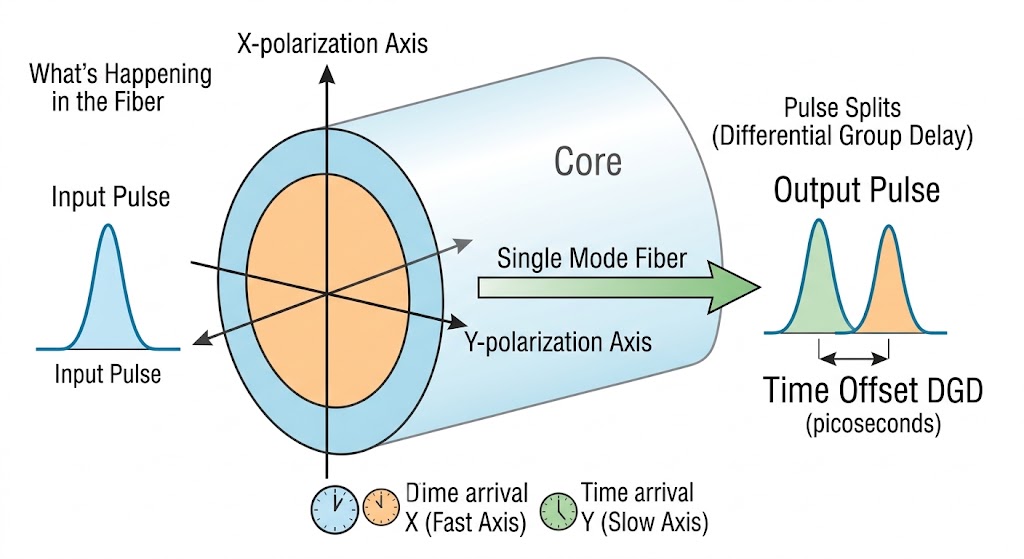
A single-mode fiber carries two versions of your signal at right angles to each other. Call them the X half and the Y half. They travel down the same core. In a perfect fiber they’d arrive at the far end at the exact same time and recombine cleanly. Nobody would ever care that they existed.
Real fibers aren’t perfect. The two halves travel at slightly different speeds. One arrives before the other. The gap between them is called Differential Group Delay, or DGD, and it’s measured in picoseconds. On short spans at low bit rates it doesn’t matter. On long spans at high bit rates it can smear your pulse enough to close the eye at the receiver.
That’s PMD in one paragraph. Everything else in this article is about why the two halves move at different speeds, why the gap keeps changing, and how you measure and fix it.
Why the two halves move at different speeds
The formal term is birefringence. It means the fiber has a slightly different refractive index on one axis than the other. Light on the “slow” axis takes a hair longer to travel the same distance as light on the “fast” axis. Two things create it.
How the fiber was made. The core is never a perfectly round circle. Manufacturing pulls the preform through a draw tower at high temperature, and small variations in the process leave the core slightly oval. It also leaves residual mechanical stress locked into the glass as it cools. Both of these are baked into the fiber for its whole life. Modern fiber (drawn from the late 1990s onward) is spun during drawing, which averages out the asymmetry and dramatically reduces intrinsic PMD. Legacy fiber wasn’t spun. Some legacy pairs have intrinsic PMD coefficients over 1.0 ps/√km, high enough to fail a 10G circuit before you even leave the plant.
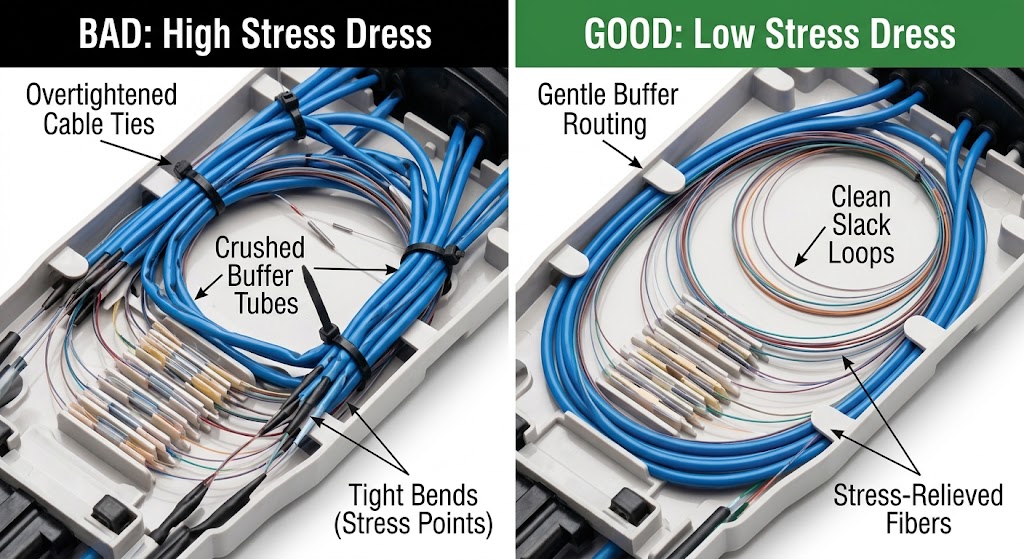
How the fiber was installed and how it’s living now. Everything you do to a cable after it leaves the reel adds birefringence on top of what the fiber already has:
- Cable ties pulled too tight around a buffer tube
- Crushed or kinked buffer tubes inside a splice enclosure
- Slack loops wound too tight
- Cable twisted during a hard pull
- Wind vibration and galloping on aerial spans, especially OPGW
- Temperature swings across seasons or day-to-night
The intrinsic asymmetry sets a floor. The external stress adds to it. Both add up to what your test set reads.
Why PMD is not like loss
Loss is a static number. Test a span today, test it tomorrow, you get the same number within test-set tolerance. The fiber attenuation isn’t going to change unless something physically happens to the cable.
PMD is not that. PMD moves. It changes with temperature. It changes with vibration. It changes as the sun heats one side of an aerial span and cools it later. If you test the same span three times in three hours you’ll get three different numbers.
This is why PMD test sets don’t report a single instantaneous value. They sample many wavelengths (or many time slices, depending on the method), average the results, and report back a statistical estimate. The number you write on your acceptance report is a best-estimate average, not an absolute value.
There are two numbers you’ll see:
DGD (Differential Group Delay) in picoseconds. The instantaneous or average delay between the fast and slow axes on this span.
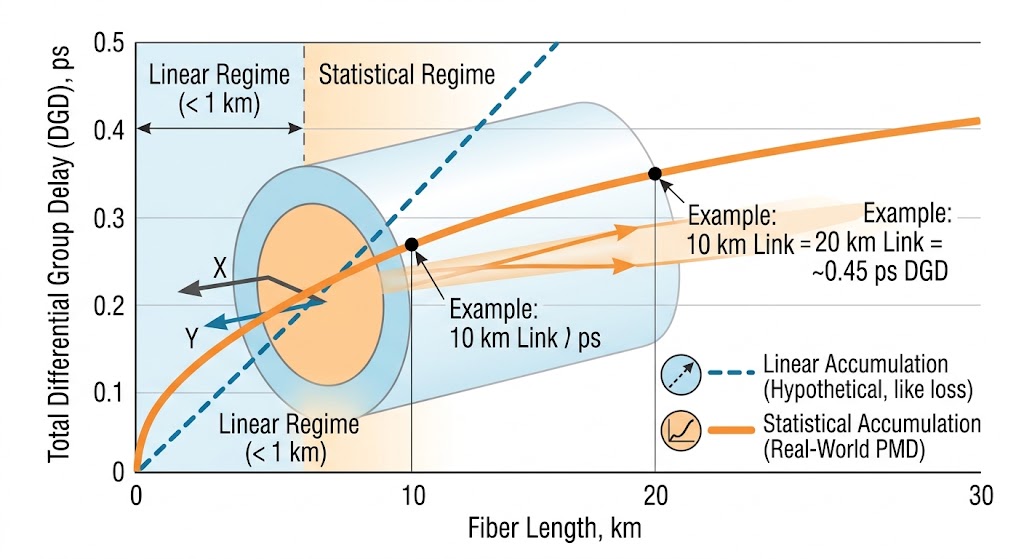
PMD Coefficient in ps/√km. A normalized number that lets you compare spans of different lengths. Note the square root. On short fiber (under about 100 meters to 1 km), DGD scales roughly linearly with length. On longer fiber it scales with the square root of length, because the polarization axes randomly couple back and forth along the run and the errors partially cancel.
If a spec sheet gives you a total DGD budget for a link, and you’re measuring a span, you multiply the coefficient by the square root of the span length to estimate the span’s DGD contribution.
The four test methods you’ll see
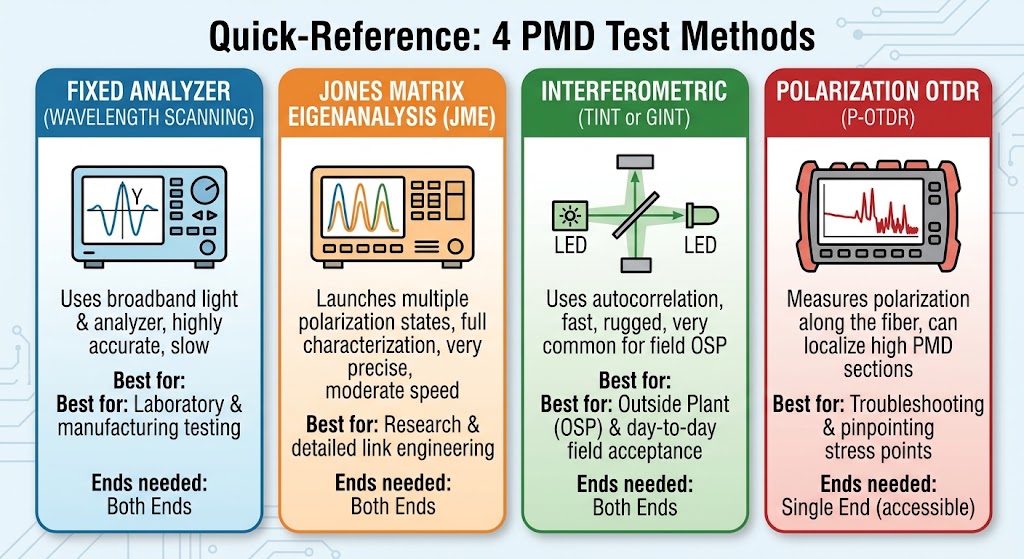
All PMD test methods except one need access to both ends of the fiber. You’ll be coordinating with a partner on a radio or a phone, confirming both ends are locked on the same wavelength plan, then running the test. Setup is slower than the measurement.
Fixed Analyzer (Wavelength Scanning)
Launch broadband polarized light at one end. At the far end, put an analyzer in front of an optical spectrum analyzer. Count the peaks and valleys the polarization creates across the spectrum. More peaks equals more DGD.
Where you’ll see it: lab benches and factory testing. You’ll rarely, if ever, run this in the field. Mostly worth knowing the name so you don’t get thrown when it comes up in a spec doc.
Jones Matrix Eigenanalysis (JME)
Launch light at multiple wavelengths in small steps. At the far end, measure the polarization state (the Stokes parameters) at each wavelength. From those, calculate the full Jones matrix that describes what the fiber did to the light. From that, you get DGD directly, and you also get the principal states of polarization, which is useful for advanced troubleshooting.
Where you’ll see it: high-precision link characterization on high-value routes. Slower than interferometric but more informative. Common on long-haul carrier acceptance.
Interferometric (TINT or GINT)
Launch broadband unpolarized light (typically from an LED or ASE source). At the far end, run the received light through a scanning Michelson or Mach-Zehnder interferometer. The interferometer produces an autocorrelation trace whose width is directly proportional to average DGD.
Where you’ll see it: outside plant, service provider trucks, day-to-day field work. Fast. Rugged. Less picky about wavelength alignment. This is what most working techs actually use. If you buy one PMD test set, buy an interferometric one.
Polarization OTDR (P-OTDR)
Same launch and same trace as a regular OTDR, but the return signal is analyzed for polarization state along the fiber. This is the only common PMD test that works from a single end. It won’t give you as clean an aggregate DGD number as the dual-ended methods, but it will localize where along the route the PMD is being generated.
Where you’ll see it: troubleshooting. You’ve measured high PMD on a span and you need to know which 500 meters of the 20 km run is causing it. A P-OTDR test can point you at the enclosure or the section that needs attention.
Reading a PMD test result
A field PMD analyzer will give you something like:
Span length:        18.4 km
Average DGD:        0.94 ps
PMD Coefficient:    0.22 ps/√km
Confidence:         92%
Samples:            256 wavelengths
Example readout — field names, layout, and values vary by analyzer.
Compare the coefficient (or the average DGD, depending on how the spec is written) against the value on the work order. Typical values you’ll be asked to hit:
| Bit rate | Typical DGD tolerance |
|---|---|
| 10G direct detect | Under 10 ps |
| 40G | Under 5 ps |
| 100G coherent | Under 25 to 30 ps |
| 400G coherent | Under 10 to 15 ps |
Typical, not universal — always check the actual transceiver spec.
A coefficient over about 0.5 ps/√km is a warning sign on any modern circuit. Over 1.0 ps/√km is a legacy-fiber problem that’s not going to get fixed with a re-dress.
What you can do about a failing span
You do the fix work in this order, because it goes from cheapest to most expensive.
First: walk the route and look for stress
If you can see the cable, walk it. You’re looking for:
- Cable ties that are visibly deforming the jacket
- Tight radius bends, especially at hardware entries and pole tops
- Slack loops that are wound too tight or clamped hard
- Buffer tubes crushed by other cables or hardware
- Aerial cables with tension issues, dampers missing, or dead-end fittings pulled too tight
Fix what you find. Re-dress splice trays with clean slack. Loosen cable ties. Replace crushed sections if you have to.
Second: re-test after fixes
Re-run PMD after each significant change. Small physical fixes can drop aggregate DGD dramatically, sometimes by a factor of two or more. If the number comes into spec, close the ticket and document what you fixed.
Third: run a P-OTDR to localize
If walking the route didn’t find anything obvious and the number is still bad, run a P-OTDR from either end. It will show you where along the route the PMD is being generated. Go to that spot. Look again.
Fourth: consider legacy fiber
If the number stays high and the route is on fiber drawn before spinning became standard, you’re not going to fix it with plant work. The fiber itself is the problem. The circuit needs to move to a modern pair, or the customer accepts a lower bit rate on that route.
Fifth: hand it off
If none of the above work and the fiber is modern, PMD compensation at the optical layer (motorized polarization controllers with variable delay lines) exists but is expensive and rare in modern deployments. Modern coherent transceivers handle PMD in the receiver DSP up to their spec limit, typically 25 to 30 ps on 100G and 10 to 15 ps on 400G. If the transceiver can’t hold the link, the transport team decides whether to move the circuit or replace the fiber.
What PMD is not
PMD is not loss. Fixing PMD won’t drop your dB loss. Fixing loss won’t drop your PMD. They’re independent problems on the same fiber.
PMD is not chromatic dispersion. Both broaden the pulse, but they broaden it for different reasons and are fixed with different methods. If you’re planning a high-speed acceptance test, you need to test for both separately. See the CD deep dive for what CD does and how it’s handled differently.
Related tools and articles
- CD and PMD Testing Overview — the big picture on both.
- Chromatic Dispersion Deep Dive — the CD companion to this article.
- Fiber Loss Calculator — for the separate loss-budget half of your acceptance testing.
- Fiber Trace Analyzer — for reading and validating OTDR traces on the same job.